How Much Do Marin Property Owners Pay in Basic (1%) Property Taxes?
Find detailed information on your parcel by visiting the Property Tax Inquiry page.
Property Tax Questions and Answers
| Fiscal Year | Net Taxes |
|---|---|
| Fiscal 2000-01 | $309,948,562 |
| Fiscal 2001-02 | $340,557,006 |
| Fiscal 2002-03 | $364,761,766 |
| Fiscal 2003-04 | $390,423,821 |
| Fiscal 2004-05 | $417,532,564 |
| Fiscal 2005-06 | $454,131,515 |
| Fiscal 2006-07 | $492,620,139 |
| Fiscal 2007-08 | $525,539,470 |
| Fiscal 2008-09 | $555,600,135 |
| Fiscal 2009-10 | $564,723,778 |
| Fiscal 2010-11 | $557,641,421 |
| Fiscal 2011-12 | $561,516,421 |
| Fiscal 2012-13 | $566,153,886 |
| Fiscal 2013-14 | $587,788,877 |
| Fiscal 2014-15 | $622,044,403 |
| Fiscal 2015-16 | $665,726,061 |
| Fiscal 2016-17 | $708,004,365 |
| Fiscal 2017-18 | $745,282,371 |
| Fiscal 2018-19 | $785,544,869 |
| Fiscal 2019-20 | $825,166,673 |
| Fiscal 2020-21 | $863,263,956 |
| Fiscal 2021-22 | $897,193,167 |
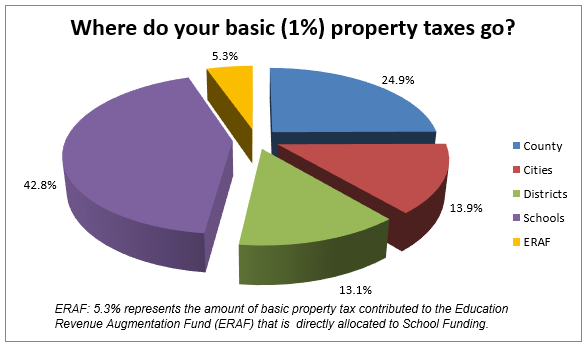
The allocation of property taxes to government agencies varies depending on historic property tax levels and the agencies that provide services in your area. The following table is provided for Marin County governmental agencies.
| Entity | 2019-20 Net Taxes |
2019-20 Percent |
2020-21 Net Taxes |
2020-21 Percent |
2021-22 Net Taxes |
2021-22 Percent |
|---|---|---|---|---|---|---|
| County | $205,224,205 | 24.9% | $220,780,428 | 25.6% | $223,529,853 | 24.9% |
| Cities | $115,244,354 |
13.9% | $121,841,300 |
14.0% | $124,928,087 | 13.9% |
| Districts | $108,052,544 | 13.1% | $114,447,304 |
13.3% | $117,488,112 | 13.1% |
| Schools | $352,887,223 |
42.8% | $369,369,780 |
42.8% | $384,055,275 | 42.8% |
| ERAF | $ 43,758,347 |
5.3% | $ 36,825,144 |
4.3% | $ 47,191,840 | 5.3% |
| Total | $825,166,673 |
100.0% | $863,263,956 | 100.0% | $897,193,167 | 100.0% |
It is a mechanism, enacted in July of 1992 by the State Legislature, to shift local tax revenues from cities, counties, and special districts to a state controlled Education Revenue Augmentation Fund. The state uses this fund to reduce their obligation to the schools. ERAF funds have been used by the State to help school and community college districts meet minimum funding requirements.
Proposition 13, the 1978 ballot measure capped property taxes in the state and thereby sharply diminished the property tax revenues that counties, cities, and special districts had to provide services. ERAF allowed the legislature to reallocate the property tax among local governments. In the midst of the recession in 1991-92, the State Legislature exercised this power to take city, county, and special district property taxes to fund the state government's obligation to support schools. The amount of the estimated shift for fiscal year 2010-11 and the prior two fiscal years from Marin County local agencies to ERAF is as shown below.
| Entity | Gross Contribution | Excess ERAF | Net Contribution | Percent |
|---|---|---|---|---|
| County | $ 78,675,104 |
$49,398,255 |
$29,276,849 |
66.9% |
| Cities | $ 19,634,504 |
$12,328,045 |
$ 7,306,459 |
16.7% |
| Districts | $ 19,281,343 |
$12,106,304 |
$ 7,175,039 |
16.4% |
| Total | $117,590,951 |
$73,832,604 |
$43,758,347 |
100.0% |
| Entity | Gross Contribution | Excess ERAF | Net Contribution | Percent |
|---|---|---|---|---|
| County | $ 82,347,789 |
$57,708,567 | $24,639,222 | 66.9% |
| Cities | $ 20,565,198 |
$14,411,900 | $ 6,153,298 | 16.7% |
| Districts | $ 20,161,887 |
$14,129,263 | $ 6,032,624 | 16.4% |
| Total | $123,074,874 |
$86,249,730 | $36,825,144 | 100.0% |
| Entity | Gross Contribution | Excess ERAF | Net Contribution | Percent |
|---|---|---|---|---|
| County | $ 85,599,840 | $54,014,517 | $ 31,585,323 | 66.9% |
| Cities | $ 21,337,633 | $13,464,300 | $ 7,873,333 | 16.7% |
| Districts | $ 20,957,813 | $13,224,629 | $ 7,733,184 | 16.4% |
| Total | $127,895,286 | $80,703,446 | $ 47,191,840 |
100.0% |