
Tracking countywide greenhouse gas (GHG) emissions
Marin County tracks greenhouse gas (GHG) emissions to measure progress and guide local climate action. Understanding where emissions come from helps the County and local communities focus on actions that can make the greatest difference.
The Marin Climate and Energy Partnership (MCEP) prepares annual GHG inventories for unincorporated Marin, local jurisdictions, and Marin County as a whole. The inventories track emissions from a wide variety of community sources, such as the energy used to power, heat, and cool buildings, the fuel used to move cars, trucks, and off-road equipment, and the decomposition of solid waste.
In general, local Climate Action Plan (CAP) goals align with California's target to reduce community GHG emissions 40% below 1990 levels by 2030. Annual GHG inventories help measure progress towards CAP goals over time. They also show which sources produce the most emissions and where there are opportunities to reduce them.
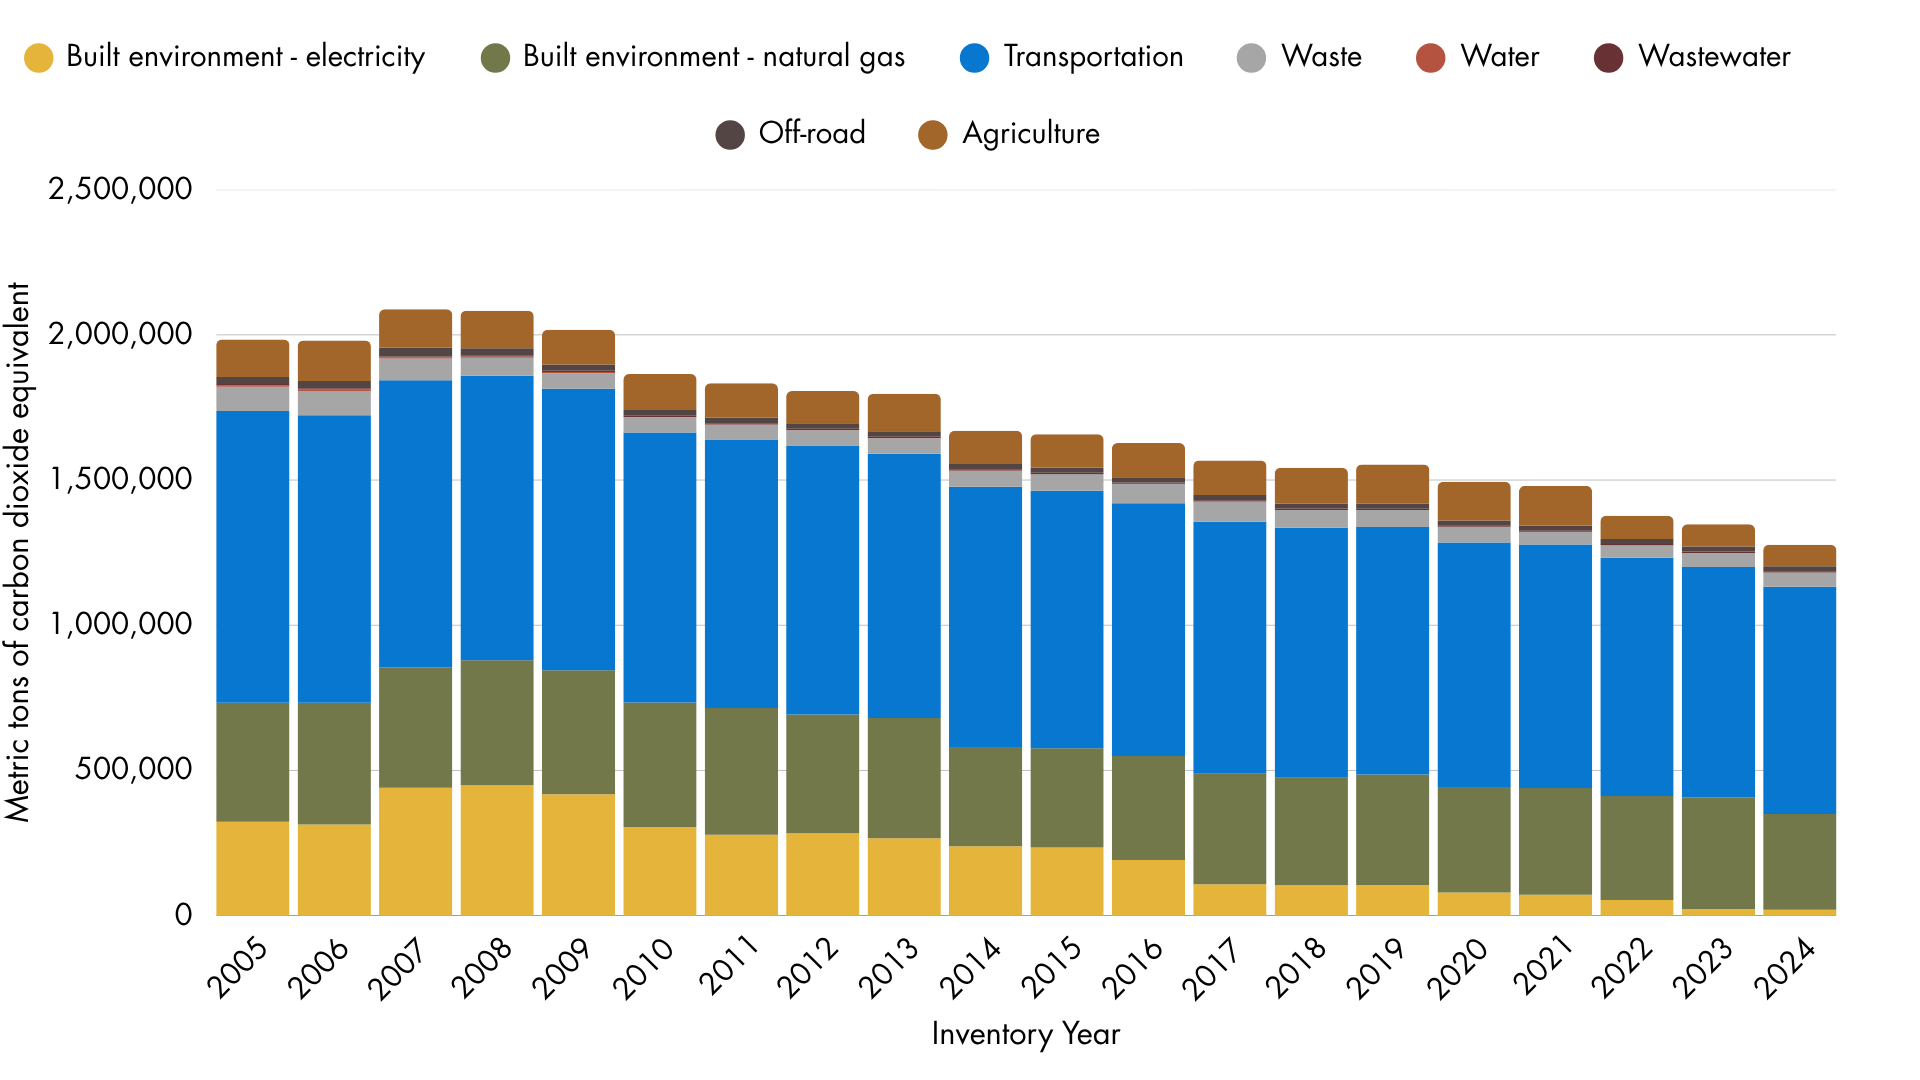
The 2024 Greenhouse Gas Inventory provides the most recent available data and shows that greenhouse gas emissions across Marin County have decreased 24% from 1990 levels. The chart and table below summarize these results. You can find the full 2024 Greenhouse Gas Inventory reports for Marin countywide and Unincorporated Marin with our Climate Action Plan documents here.
Marin County greenhouse gas emissions by source, 2005–2024
| Year | Built Environment - Electricity | Built Environment – Natural Gas | Transportation | Waste | Water | Wastewater | Off-Road | Agriculture | Total | % Change from 2005 |
|---|---|---|---|---|---|---|---|---|---|---|
| 2005 | 323,152 | 409,977 | 1,004,378 | 83,657 | 5,470 | 4,354 | 24,292 | 128,845 | 1,984,126 | |
| 2006 | 313,871 | 419,044 | 990,524 | 82,898 | 5,349 | 4,174 | 25,299 | 139,634 | 1,980,793 | 0% |
| 2007 | 440,073 | 415,121 | 988,728 | 74,780 | 2,906 | 4,186 | 29,819 | 132,541 | 2,088,154 | 5% |
| 2008 | 448,786 | 430,569 | 979,951 | 62,190 | 3,670 | 4,210 | 24,892 | 129,096 | 2,083,364 | 5% |
| 2009 | 418,042 | 426,802 | 969,686 | 53,589 | 4,040 | 4,220 | 21,553 | 119,528 | 2,017,461 | 2% |
| 2010 | 305,353 | 429,024 | 929,121 | 52,507 | 1,360 | 4,248 | 19,741 | 123,860 | 1,865,216 | -6% |
| 2011 | 278,256 | 437,153 | 923,989 | 51,320 | 705 | 4,274 | 19,336 | 118,147 | 1,833,180 | -8% |
| 2012 | 284,145 | 408,390 | 926,194 | 53,124 | 590 | 4,320 | 19,014 | 110,850 | 1,806,626 | -9% |
| 2013 | 266,264 | 414,285 | 909,876 | 53,770 | 767 | 4,343 | 18,785 | 129,132 | 1,797,222 | -9% |
| 2014 | 239,196 | 342,023 | 895,972 | 54,385 | 989 | 4,398 | 18,575 | 113,862 | 1,669,401 | -16% |
| 2015 | 234,577 | 341,777 | 887,030 | 56,412 | 615 | 4,395 | 18,317 | 114,823 | 1,657,947 | -16% |
| 2016 | 191,493 | 358,344 | 870,439 | 66,255 | 493 | 4,493 | 17,985 | 117,949 | 1,627,451 | -18% |
| 2017 | 108,474 | 379,795 | 868,245 | 69,276 | 462 | 4,474 | 17,602 | 118,665 | 1,566,992 | -21% |
| 2018 | 104,889 | 369,667 | 861,044 | 61,565 | 0 | 4,464 | 17,970 | 122,371 | 1,541,971 | -22% |
| 2019 | 105,537 | 380,433 | 851,957 | 58,670 | 0 | 4,454 | 17,356 | 135,585 | 1,553,992 | -22% |
| 2020 | 79,811 | 363,543 | 841,830 | 54,304 | 0 | 4,469 | 17,065 | 132,858 | 1,493,880 | -25% |
| 2021 | 71,807 | 367,764 | 838,236 | 44,569 | 0 | 4,435 | 17,094 | 135,783 | 1,479,687 | -25% |
| 2022 | 53,563 | 358,339 | 820,572 | 42,847 | 0 | 4,374 | 17,113 | 79,947 | 1,376,755 | -31% |
| 2023 | 22,592 | 384,108 | 794,075 | 48,469 | 0 | 4,456 | 17,128 | 76,582 | 1,347,411 | -32% |
| 2024 | 20,519 | 329,878 | 782,439 | 49,003 | 0 | 4,454 | 16,722 | 74,028 | 1,277,044 | -36% |
| Change from 2005 | -302,633 | -80,099 | -221,939 | -34,654 | -5,470 | 100 | -7,570 | -54,817 | -707,082 | |
| % Change from 2005 | -94% | -20% | -22% | -41% | -100% | 2% | -31% | -43% | -36% |
Climate action and progress
Climate Action Plans across Marin include similar strategies to reduce greenhouse gas (GHG) emissions and support countywide climate goals. Explore highlights of current programs and progress in each sector, along with actions you can take to reduce GHG emissions:
Transportation
Transportation is the largest source of GHG emissions in Marin, accounting for approximately 61% of Marin’s emissions in 2024 with most transportation emissions coming from passenger vehicles.
Marin County works with local and regional partners to reduce transportation emissions by supporting public transit, walking, biking, carpooling, and zero-emission vehicles (ZEVs).
- More Marin residents are driving ZEVs. Marin had 23,346 ZEVs at the end of 2024 and ranked 2nd among California counties for ZEV ownership per person. ZEVs made up 11% of registered automobiles and 40% of new registrations in 2024. By the end of 2025, ZEVs made up 13% of registered vehicles and 36.8% of new vehicles.
- Transit ridership has increased. By the end of 2024, Marin Transit ridership had exceeded pre-pandemic levels. In fiscal year 2024–25, fixed-route ridership increased 10% compared with the previous year.
- Redwood Bikeshare supports first- and last- mile transit connections. In addition to shifting to ZEVs, getting drivers out of single occupancy vehicles is critical to reducing vehicle emissions and relieving congestion on Marin's roadways. The Redwood Bikeshare Pilot launched in October 2024 to help people travel between public transit and their destinations. By early 2025, 300 e-bikes were available at 56 mobility hubs along the SMART train corridor from Santa Rosa to Larkspur.
- Local governments are transitioning to ZEVs. The County and Marin's cities and towns are installing public charging stations and transitioning their vehicle fleets to ZEVs. In 2025 and 2026, the County and 8 cities and towns received Metropolitan Transportation Commission grant funding to develop fleet electrification transition plans.
- The County is expanding EV charging. The County maintains 104 EV charging ports at 9 County locations. This includes 71 public charging ports and 33 ports for County fleet vehicles.
- Bike, walk, carpool, or take transit when possible. Learn more at Marin Commutes.
- Find resources for walking and biking to school through your local Safe Routes to Schools Program.
- Consider an all-electric or plug-in hybrid vehicle. Explore options on our Electric Transportation Hub.
- Reduce emissions and save fuel by shutting your car off while waiting, such as during school pick-up and drop-off or while picking up food.
Building Energy Use
Energy used in residential and commercial buildings is the second largest source of GHG emissions in Marin. Natural gas use is the main source of these building emissions and accounts for 26% of countywide emissions. Emissions from electricity use have decreased 94% since 2005 as Marin's electricity supply has shifted to more renewable and lower-carbon sources.
The Climate Action Plan focuses on using energy more efficiently, replacing gas appliances with efficient electric options, supporting renewable energy, and strengthening local building requirements.
- Electrify Marin helped more households switch from gas to electric appliances. From January 2019 to November 2025, the Electrify Marin Rebate Program provided $1.4 million in rebates for 1,524 gas-to-electric appliance upgrades. These included water heating, space heating, and induction cooking. The upgrades reduce GHG emissions by an estimated 1,801 metric tons of CO2e each year, equal to about 4.6 million fewer passenger-vehicle miles traveled.
- BayREN programs are helping residents and businesses make energy upgrades. From January 2024 through August 2026, BayREN programs assisted more than 150 residents, 4 multifamily properties, and 7 small businesses with energy upgrades. The programs provided almost $1 million to support these projects.
- Public agencies are replacing gas water heaters. Since 2022, the Energy Watch Partnership has helped public agencies replace gas water heaters with high-efficiency heat pump water heaters. As of 2026, the program has replaced 53 water heaters at 45 sites across 17 public agencies.
- Local building requirements support energy efficiency and electrification. The County's Green Building Reach Codes require new construction and residential remodel projects to achieve energy savings beyond State minimum requirements. For single-family remodels, the County's Flex Path policy offers a flexible menu of options to meet a required energy-savings target, including heat pumps, heat pump water heaters, solar, insulation, air sealing, and induction cooking. In 2023 and 2024, 129 remodel projects were subject to Flex Path requirements. Completed projects achieved an estimated 533 MMBtu in additional annual energy savings, equal to about 28 metric tons of carbon dioxide emissions avoided each year. The County has also supported 6 Marin cities and towns in adopting similar policies.
- Planning ahead can make it easier to switch to electric when it is time for a replacement. Before your gas or propane furnace, water heater, or other appliance needs to be replaced, learn about heat pumps and other efficient electric options. When making home upgrades, look for opportunities to optimize your electrical panel and wiring for future electric appliances or an EV charger. Learn more at our Electrify Marin Hub.
- Try induction cooking. Induction cooktops cook quickly and do not produce the indoor air pollutants created by burning gas. Learn how to try an induction cooktop through Marin County Free Library on our Induction Cooking webpage.
- Get a home energy assessment to help you understand your energy use and identify ways to improve efficiency, lower energy costs, and make your home more comfortable. Find available programs on our Home Energy Assessments page.
- Make simple energy-efficiency improvements. Weatherstripping, LED light bulbs, and smart power strips are low-cost, renter friendly and can help reduce energy use. Each summer, the Rising Sun Center for Opportunity Green House Call Program provides many of these improvements at no cost to participating renters and homeowners. Visit the Green House Call website for current program information.
- Invest in building shell improvements by upgrading your insulation, and sealing air leaks. These improvements can reduce energy use and make your home more comfortable. Learn more on our Resources for Residents page.
Waste
Waste creates greenhouse gas (GHG) emissions when organic materials, such as food and yard waste, break down in landfills. This process produces methane, a powerful greenhouse gas. Over a 100-year period, methane traps about 28 times more heat in the atmosphere than carbon dioxide.
Reducing waste and keeping organic materials out of landfills are important parts of meeting Marin's climate goals.
Note: The GHG inventory only includes emissions from the disposal of waste. It does not include emissions from making, transporting, and distributing the products we buy and use. Learn more about these consumption-based emissions below.
- Composting service has helped lower emissions. Waste generated by the community increased 1% from 2023 to 2024, while GHG emissions from waste disposal decreased 41%. This decrease was largely due to estimates showing less organic material in landfilled waste and the types of material used for alternative daily cover.
- Organic material still remains a large part of Marin's landfill waste. A 2024–25 waste characterization study found that organic material made up 36.5% of Marin's landfill waste. These findings have helped Zero Waste Marin focus education, outreach, and workshops on keeping food scraps and yard waste out of the landfill.
- Prevent food waste by planning before grocery trips and buying only what you need. Find more food waste prevention tips at Zero Waste Marin.
- Compost! Put your food scraps, yard waste, and unlined soiled paper in your green compost cart, or compost them at home.
- Keep useful items out of the landfill by repairing, reusing, donating, or finding a new home for them. Find local resources and donation services at Zero Waste Marin.
- Make waste sorting easy. Set up separate containers for compost, recycling, and trash aligned with your waste hauler. Make sure everyone in your home or building knows what goes in each container.
- Safely dispose of hard-to-recycle and hazardous materials, including electronics, batteries, mattresses, bulky items, paint, and other hazardous materials need special handling. Visit Zero Waste Marin or your local Household Hazardous Waste facility for more information.
Water
Marin experiences periodic droughts, making water conservation an ongoing priority. Over the past 2 decades, the community has reduced water use by installing water-efficient fixtures and appliances, replacing lawns with water-wise landscaping, and taking other conservation steps. In 2024, water use was 26% lower than in 2005, although it increased 4% from 2023 to 2024.
Energy is needed to pump, treat, and deliver water across Marin. GHG emissions from these activities decreased nearly 100% from 2005 to 2024. This decrease is largely due to local water agencies switching to renewable and carbon-free electricity.
- Water agencies are using cleaner electricity. Marin Water and North Marin Water District (NMWD) purchase MCE Deep Green 100% renewable electricity service. Sonoma Water, which supplies about 25% of Marin Water's water and 80% of NMWD's water, also uses renewable and carbon-free electricity.
- Water agencies help customers conserve water. Marin Water and NMWD offer rebates and other programs to help homes and businesses reduce water use. Available resources include leak notifications, home water monitors, lawn replacement incentives, and other water conservation programs.
- Install water-efficient nozzles and fixtures for your home’s faucets, showerheads, and toilets. Local water districts offer water-saving devices to customers at no cost.
- Use less hot water. Wash with cold water when possible, and take shorter showers. This saves both water and the energy needed to heat it.
- Choose water-saving, energy-efficient appliances. When it is time to replace a dishwasher or clothes washer, look for water- and energy-efficient options.
- Replace your landscaping with water-wise options. Check your local water district for incentives, such as Cash for Grass, and garden inspiration and assistance.
- Conserve water through water-efficient landscaping tools and programs, including drip irrigation, rainwater capture, irrigation timing, and leak alerts. Learn more from Marin Water and North Marin Water District.
Agriculture
Agriculture is an integral part of Marin County’s economy, identity, and climate future. Agricultural GHG emissions are estimated using livestock numbers and acres of agricutural production. Recent declines in the number of cows in Marin due to ranch and dairy closures has led to a 43% decrease in emissions since 2005.
Marin's climate goals also support agricultural practices that remove carbon dioxide from the atmosphere and store carbon in soil and plants. This process is called carbon sequestration. The County of Marin works with the Marin Resource Conservation District (Marin RCD) and Carbon Cycle Institute to track carbon sequestration from local carbon farming practices. This includes projects such as compost application, tree planting, and stream restoration supported by Marin RCD and other public, private, nonprofit, and independent programs across the county.
- Carbon farming is storing carbon on Marin's working lands. Marin RCD and partner data show that carbon farming practices implemented between 2005 and 2025 have sequestered an estimated 76,089 metric tons of carbon dioxide equivalent (MTCO2e). These practices are estimated to sequester an average of 21,521 MTCO2e each year on Marin's working lands, which is equivalent to avoiding nearly 55 million miles driven by a gas vehicle.
- Compost application is an important carbon farming practice. Available project data show that compost was applied to about 4,284 acres of Marin's working lands from 2020 through 2025. Programs supporting these projects included CDFA Healthy Soils, Zero Foodprint, Fibershed, Marin Agricultural Land Trust (MALT), and Marin RCD.
- Support local farms, dairies, and ranches by shopping at a local farmers market and stores carrying local products. Find local farmers markets and information on Farm Fresh Nutrition Access for low-income households from Agricultural Institute of Marin.
- If you are a farmer or rancher, get support with developing and implementing carbon farm practices. Find out more at Marin RCD.
- Compost your food and yard waste. Put food scraps, yard waste, and unlined food-soiled paper in your green compost cart, or compost these materials at home.
- Build healthy, carbon-storing soil at home by using compost and other soil-building practices in your garden. Avoid practices that can damage soil, such as frequent or intensive tilling and unnecessary use of synthetic fertilizers. Find climate-friendly gardening tips from UC Marin Master Gardeners.
Consumption-based Emissions
The sections above focus on greenhouse gas (GHG) emissions associated with activities within Marin County. However, there are also emissions associated with the goods and services that residents in Marin consume. These are called consumption-based emissions.
Consumption-based emissions can occur throughout a product's life cycle, including:
- Extracting raw materials
- Manufacturing products
- Transporting and selling products
- Using products and services
- Disposing of materials
Consumption-based emissions can be much larger than the emissions included in a traditional community GHG inventory. They are also harder for local governments to measure and address because many occur outside their boundaries. Even so, reducing these emissions is an important part of climate action.
- Marin is reducing emissions from concrete used in construction. In 2019, Marin County adopted the nation’s first Low Carbon Concrete Ordinance. The ordinance reduces the climate impact of concrete by limiting the amount of cement used or requiring concrete mixes to meet standards for embodied carbon. In 2023 and 2024, projects covered by the ordinance avoided about 138,000 pounds of Portland cement, a carbon-intensive ingredient in concrete. This prevented an estimated 49 metric tons of carbon dioxide emissions, equal to about 125,000 miles driven by an average gasoline-powered passenger vehicle. The ordinance has also helped expand the local market for lower-carbon concrete. The County developed a model ordinance and provided support to other communities. Santa Monica, Palo Alto, Mill Valley, and Sausalito have adopted similar requirements.
- Learn about your carbon footprint. Join a Resilient Neighborhoods Climate Action Workshop to explore ways to reduce emissions through everyday choices.
- Before buying something new, consider whether you can repair what you have or find a used or repurposed option. Visit Zero Waste Marin for resources and local repair fairs.
- When renovating a home or workplace, look for opportunities to keep and reuse existing materials before buying new ones.
- Shop green and local when possible. Use the online Green Business directory to find local Certified Green Businesses with county-verified environmental practices in place.